TARGET2, the Eurozone's large-value payment system, is as contested as it is essential. It ensures that euros are treated equally in the entire Eurozone and underpins common monetary policy. Critics however hold that growing TARGET2 positions during the financial crisis and beyond constitute a covert bail-out mechanism for Eurozone countries with chronic trade deficits. This argument draws an unwarranted connection between trade patterns and financial flows in the Eurozone whose policy implications could break up monetary union. Risk assessments and liquidity preferences, not trade, determined the evolution of TARGET2 positions since 2008.
Introduction
TARGET2 (T2) is the Eurosystem's cross-border settlement mechanism for large-value payments. The system provides a central infrastructure for financial institutions to make cross-border payments and settles emerging net balances after every trading day. A little-known technical feature before 2011, the T2 system became the subject of fierce academic debate throughout the course of the Eurozone crisis. Whereas the European Central Bank (ECB) describes T2 as "essential for the smooth processing of [cross-border] payments,"1 German economist Hans-Werner Sinn described it as a covert bail-out mechanism for distressed Eurozone countries.2 His argument struck a chord with lingering Euroscepticism in Germany and eventually led to an unlikely entrance of the T2 system within the political limelight.
Following Sinn's fist intervention, scholars have produced an impressive amount of work in an attempt to clarify the role of T2. Although few of them supported Sinn's original argument of a 'stealth bail-out,'3 the conclusion that critics of Sinn's position have "won the scholarly argument hands down" against him may be premature.4 In fact, the "wonkiest web debate ever" seems far from over.5 Arguments that T2 transforms the Eurozone into a 'shadow transfer union'6 and silently bails out otherwise insolvent Eurozone countries7 continue flaring up regularly. Somewhat expectedly, German media was ripe with criticism of T2 when the Bundesbank's claims edged closer to the magical number of a thousand billion in 2018.8 In 2019, the debate reached the finance committee of the Bundestag, where the Eurosceptic, right-wing Alternative for Germany (AfD) demanded that collateral be posted to guarantee T2 liabilities.9 Similarly, Sinn at various junctures10 proposed to impose a ceiling on T2 balances or to devalue currencies of individual Eurozone countries. At best, these policy proposals would fragment money markets and trigger large-scale capital flight. It is anyone's guess whether common monetary policy could prevail under such conditions. Therefore, it is important to shed further light on the functioning of T2 since technical aspects have long given way to political considerations.
Why did persistent T2 balances emerge in the Eurozone after 2007? This essay revisits the debate around the mounting T2 balances between 2008 and 2012, discussing the claim that T2 balances arise from trade deficits and represent trade-financing credit from public monetary institutions. T2 is a constitutive component of monetary union. T2 balances reflect relative liquidity preferences and grow in response to asymmetries, failures, and blockages in the financial architecture of the Eurozone. Therefore, rather than a cause for concern, the T2 system is an insurance mechanism that acts as a surrogate for a more complete fiscal and financial union while also facilitating common monetary policy.11
The first section of this contribution describes the functioning of T2 by tracking an example transaction. It also describes the system's multilateral settlement procedure that may lead to net balances as an accounting identity. The second section outlines the centrality of T2 for money markets and payments in monetary union. Section three dissects the argument that T2 liabilities financed trade deficits and argues that current account data cannot effectively account for the emergence of TARGET balances. Section four subsequently presents evidence that T2 balances between 2008 and 2014 were driven by financial flows reacting to (perceived) differentials in default, liquidity, and redenomination risk across the Eurozone. Finally, section five analyzes the evolution of T2 balances after 2015, arguing that renewed divergence is attributable to the direct and indirect effects of ECB asset purchases.
The TARGET System
TARGET stands for Trans-European Automated Real-time Gross Settlement Express Transfer System. It is the Eurozone's large-value payment system and has been in operation since the introduction of the Euro in 1999. Following an update in 2007, the system acquired the suffix '2' to denote the migration from a network of national real-time gross settlement mechanisms to a single shared platform. Beyond gains in efficiency and security, this change had little effect on the fundamental role of the system for the financial architecture of the Eurozone. By integrating money markets and capital flows, the T2 system enables the uniform transmission of common monetary policy and promotes the integration of European financial markets.12 For financial institutions, T2 provides a central infrastructure to make cross-border payments from one central bank area of the Eurozone to another. Eligible commercial banks hold money in the form of central bank liquidity in accounts at their National Central Banks (NCBs). The ECB, on behalf of the Eurosystem, acts as 'common settlement agent' and banks make payments "by exchanging the liabilities of this settlement [agent]."13
As of 2019, more than one thousand credit institutions were direct participants of the integrated platform, connecting almost 45,000 banks globally through various branches and subsidiaries.14 These banks perform T2 transactions when they transfer capital between branches located in different countries to manage cash flow and liquidity, purchase foreign assets like sovereign bonds, or decide to repatriate funds after a change in risk outlook. Banks may also use T2 on behalf of private and corporate customers to purchase foreign goods and services or invest abroad. In 2019, the T2 system processed 88 million of these transactions with average value of €5.2 million and a median of just €7,400, indicating that T2 is increasingly important for smaller retail transactions.15
The T2 system settles cross-border payment orders in the sense that it "discharges obligations in respect of funds […] transfers between two or more parties."16 In an example related to the current account, a firm in France that purchases cybersecurity services from a software developer in Spain would trigger a T2 transaction. First, the importing French firm instructs its commercial bank, Crédit Agricole, in France to wire payment for the cybersecurity services to the bank of the software developer, Banco Santander, located in Spain. To effectuate the payment, Crédit Agricole sends a SWIFT17 message via the T2 system, which automatically associates the origin and destination of the transfer with the NCBs of the involved commercial banks. In this case, the transaction runs from the jurisdiction of the Banque de France (BdF) to that of the Banco d'España (BdE). After receiving the payment message via T2, the BdF debits the current account that Crédit Agricole holds in the Eurosystem with the value of the payment. Moreover, in order to preserve the accounting identity of matching assets and liabilities on its balance sheet, the BdF acquires a temporary liability on the BdE.18 The BdE reciprocates and confirms the transaction by reporting a corresponding claim on the BdF and credits the current account of Banco Santander with the value of the payment order. The exchange of temporary claims and liabilities between the NCBs is necessary to offset the disequilibrium arising from the transaction which decreases the liabilities of BdF vis-à-vis Crédit Agricole and increases the liabilities of the BdE vis-à-vis Banco Santander.
For commercial banks Crédit Agricole and Banco Santander, settlement is seamless. They debit (credit) the reserve account of their customer in France (Spain) and see an equivalent amount of liquidity eliminated (created) in the current account they hold with their NCB. Because gross-settlement happens in real-time, commercial banks can immediately reuse liquidity obtained via a T2 transfer in subsequent transactions. For the French and Spanish NCBs, final settlement is more complicated and involves a two-step clearing process. First, T2 clears ('nets out') all intra-day gross transactions (one of them arising from the cybersecurity services purchase) between central bank areas into bilateral net balances between pairs of NCBs. Second, after every trading day, the T2 system clears or 'nets out' these balances multilaterally between NCBs. In this way, the BdE's claim on BdF could be partially or fully offset by the claim of another NCB. The emerging net balances are multilateral in nature and reflect for every NCB the net outflows or inflows of liquidity vis-à-vis the entire Eurozone. In order to settle these multilateral net balances, NCBs in surplus acquire a permanent T2 claim and NCBs in deficit acquire a permanent T2 liability on the Eurosystem as a whole. The daily emerging multilateral net balances are carried forward as claims and liabilities on the balance sheet of the ECB. It is through the interplay of cross-border claims and liabilities between NCBs and the subsequent multilateralization of positions that T2 discharges obligations between agents.
TARGET2 System and Monetary Union
The T2 system is what differentiates the Eurozone from an area with fixed exchange rates.19 While fixed exchange rate areas maintain decentralized monetary policy where foreign reserve management is imperative, monetary union does away with the monetary foreign constraint. This means that a shared agent is responsible for deciding and implementing common monetary policy. Also, exchanges of domestic currency for foreign currency are unlimited, which relieves the NCB of foreign reserve management, the threat of speculative attacks, and the specter of devaluation.
The crucial feature that "irrevocably unifies the former national currencies," however, is a union's payment system.20 In fact, Mazzocchi and Tamborini argue that a monetary union is "first and foremost a payment union."21 This is because the payment mechanism is the instrument that ensures that all forms of money (domestic, foreign, banknotes, liquidity) are treated equally and settled at par. In the Eurozone, by indiscriminately settling payments, T2 makes it immaterial where a euro originated. Yet, by leaving traces in the form of intra-Eurosystem claims and liabilities on the ECB's balance sheet, it signals asymmetries in the payments it settles. These asymmetries give clues about relative liquidity preferences in central bank areas and the volume of refinancing operations by individual NCBs. Thus, while T2 ensured the integrity of monetary union, the information it produced inspired criticism. This criticism was all the more pungent as it aligned well with a pro-German bias and a stigmatization of the Eurozone's periphery. In this context, it is unfortunate that the Eurosystem inherited the national boundaries defining the European Union22.
T2 Balances and the Current Account
Because T2 net balances represent cumulative flows over time, they emerge when individual Eurozone countries are either net liquidity importers or exporters over a sustained period. A country is a net liquidity exporter if its credit institutions with access to central bank refinancing transfer more liquidity to other institutions in the Eurozone than they receive. As a consequence, the country's NCB accumulates net liabilities vis-à-vis the Eurosystem in T2. Importantly, T2 balances need not emerge even when countries run large current account (CA) deficits. This is because the T2 transactions associated with a CA deficit can be offset by those associated with the Financial Account (FA). For instance, private investors may export capital to central bank areas with CA deficits, creating gross T2 claims on the balance sheet of the receiving NCB. Similarly, commercial banks in a central bank area with net liquidity inflows may use these funds to lend them back to their counterparties experiencing net outflows via the interbank lending market.
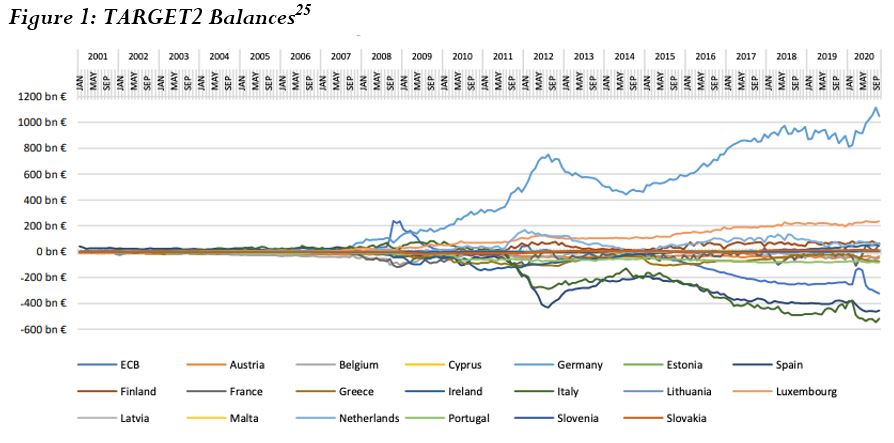
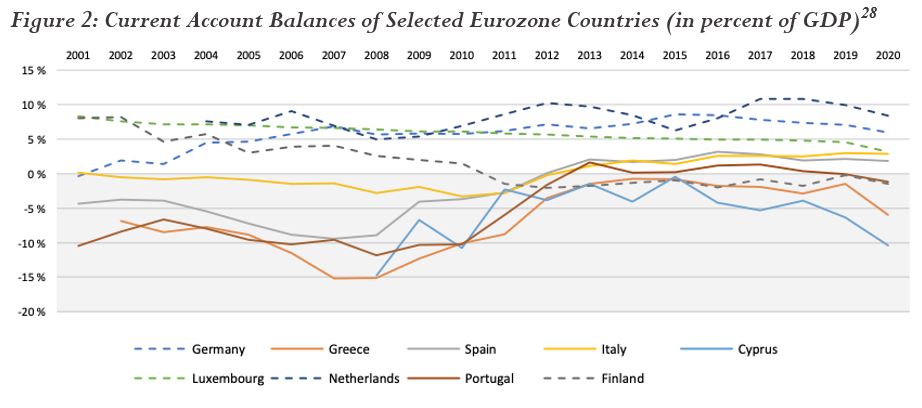
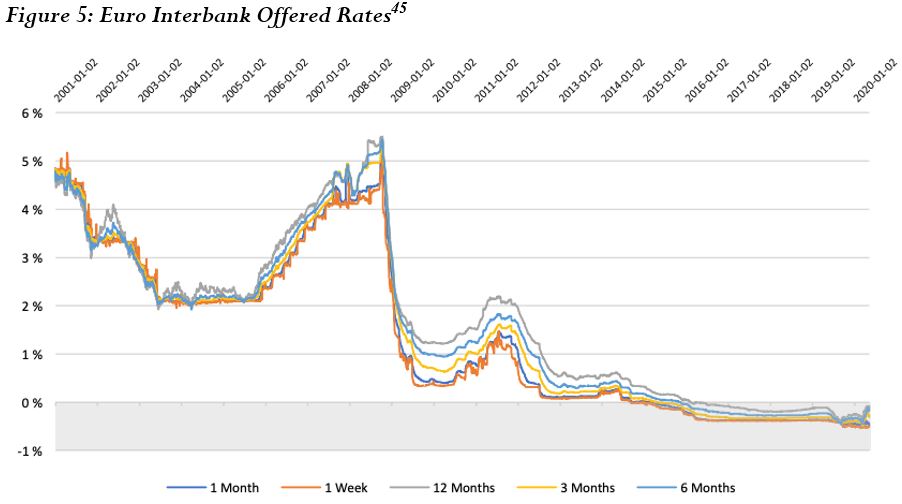
Since CA- and FA-related T2 transactions interacted smoothly, no significant TARGET imbalances emerged in the Eurozone before the end of 2007 (Figure 1). This happened not for a lack of CA imbalances. Spain, Portugal, Greece, Cyprus, and to a lesser extent Italy, all ran sizeable trade deficits before the global financial crisis. On the other hand, countries including Germany and the Netherlands were net exporters (Figure 2). At first sight, the group of countries with CA deficits roughly intersects with those countries that developed sizeable T2 deficits after 2007. This observation led Sinn23 and Tornell and Westermann24 to associate T2 balances with trade deficits and therefore structural Eurozone imbalances. In their view, profitable private capital flows to net importers gave way to public credit via T2 because interest rates in these countries were not high enough to account for credit and redenomination risk. Rates on the interbank market, a measure of credit risk of financial institutions, indeed went up from little over 2 percent in 2006 to over 5 percent in 2009 (Figure 5). This, however, does not prove that causality runs from structural imbalances to a withdrawal of private trade finance. It merely attests to the decreased willingness of commercial banks to lend funds to their counterparties in distressed countries, interrupting the FA-related flows that had offset liquidity outflows until 2007.
When T2 imbalances emerged in late 2007 they did so with a significant time lag to CA deficits which were present since the formation of Economic and Monetary Union (EMU). Moreover, during the financial crisis, T2 imbalances rose above and beyond what would have been necessary for countries to finance trade.26 A more systematic assessment of T2 balances in context of the CA yields scant evidence of an association: there was no significant correlation between changes in the CA and changes in T2 balances between 2005 and 2007. For the period from 2008 to 2010 the relationship was positive but turned negative for 2011-2013.27 If growing T2 imbalances replaced private trade finance, it is puzzling that both Spain"s and Italy"s T2 liabilities rose as they reduced their trade deficit between 2010 and 2012 (Figures 1&2).
Arguments that CA deficits acted as drivers of T2 divergence are typically presented in two steps. First, EMU all but eliminated risk premia previously applied to peripheral countries, which made foreign capital plentiful and made borrowing cheap.29 The result was an unsustainable catch-up process with excessive risk-taking and growing bubbles.30 Second, the financial crisis exposed a systematic competitiveness problem in countries with CA deficits as "prices and wages rose beyond the level [of] sustainable economic development." 31
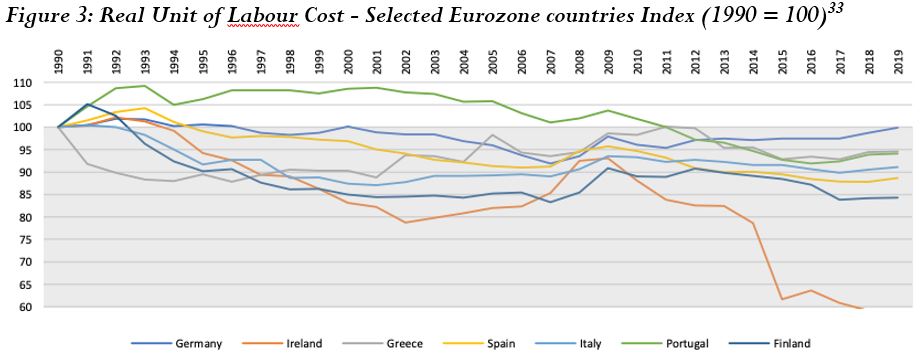
Yet, evidence for a structural competitiveness problem is patchier than this narrative suggests. Real unit of labor costs, a measure of aggregate wages as a share of output, have declined in all countries except Portugal since 1990 (Figure 3). Reductions in Spain, Italy, Ireland, and initially Greece were larger than in Germany, suggesting that wages alone cannot explain a competitiveness problem. Overall, the real wage rate, a measure of labor compensation, rose slower than labor productivity throughout the Eurozone.32 This underlines that wage growth did not give rise to structural imbalances that precipitated T2 balances during the financial crisis.
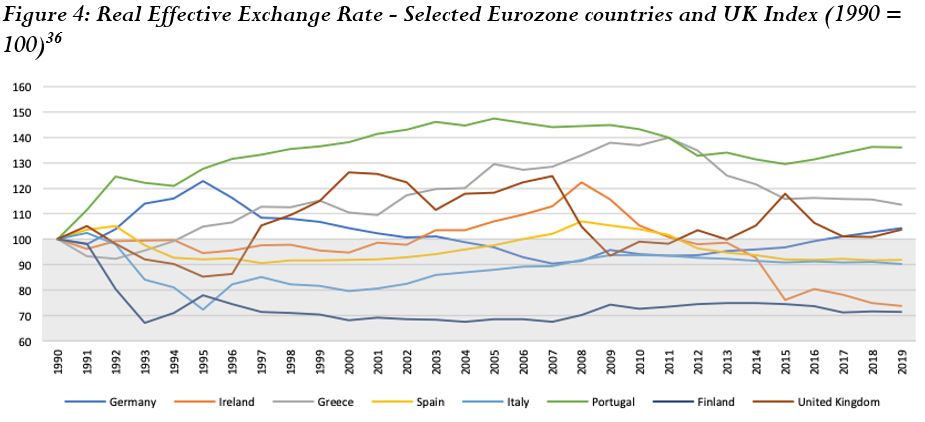
Felipe and Kumar note that except for Greece, increases in the unit labor costs stemmed primarily from a rise in the price index34 At first sight, this seems to suggest that inflation rather than growing wages was the cause for a loss in competitiveness. Yet, evidence for systematically higher inflation in countries with T2 liabilities and a competitiveness problem is once more unconvincing. Differentials in price increases are captured by data on the real effective exchange rate (REER), a measure of price competitiveness vis-à-vis trading partners that is deflated by the consumer price index. REER data shows that among the selected Eurozone countries, only Portugal and Greece experienced a systematic appreciation of prices since 1990 (Figure 4). After EMU, Spain, Ireland, and Italy also appreciated notably. Yet, employment in manufacturing was constant in these countries, suggesting that arguments about a systematic deterioration in competitiveness are overblown.35
A final point on the CA explanation for T2 balances is theoretical. Although the CA and FA are cleared by an accounting convention in the Balance of Payments (BoP), it is misleading to describe financial flows in terms of CA deficits and surpluses. First, CAs in the Eurozone may not be the primary determinants of financial flows. Indeed, Gabrisch finds evidence for reverse causality, showing that liquidity preference determines financial flows (FA), which in turn affect trade patterns in the real economy (CA).37 Second, even if the FA accommodates trade imbalances, the CA is 'silent" about the direction of gross financial flows and the associated distribution of risk therein.38 In fact, in an integrated market like the Eurozone, CA data may not even reflect net financing flows. This is because the actual financial flows depend on the origin of capital and the location of the credit-providing intermediaries. A net-exporting country is therefore not automatically a net provider of credit to net-importing countries. In the Eurozone for instance, large financial institutions in Germany, France, and the Netherlands channeled savings from outside the Eurozone into euro countries with future T2 liabilities.39 Hence, there was no clear-cut creditor-debtor relationship based on the CA within the Eurozone. In fact, causality may have run from the FA to the CA.
T2 Balances since 2015: Renewed Divergence
Since 2015, there has been a renewed trend of divergence particularly in the T2 balances of Germany, Spain, Italy, and that of the ECB (Figure 1). Reassuringly, T2 changes were not correlated with spreads between credit default swaps, indicating that investors were not responding to perceived sovereign default risk in individual Eurozone countries. However, Minenna reports a strong association between the ECB's Asset Purchase Programmes (APPs), launched in mid-2014, and the evolution of T2 balances: APP volumes are linearly correlated with T2 liabilities in Spain, Portugal, and Italy and T2 claims in Germany, the Netherlands, and to a lesser extent Finland. In a 2017 assessment, the ECB ascribed 80 percent of the divergence in T2 balances that had occurred since 2015 (100 percent in the case of the ECB's T2 balance) to the ‘mechanical effects' of asset purchases. Similarly, Germany's Bundesbank attributed its growing T2 claims to a flare-up of financial uncertainty in Greece in 2015 (and the resulting liquidity contraction) and the effects of the ECB's asset purchases.
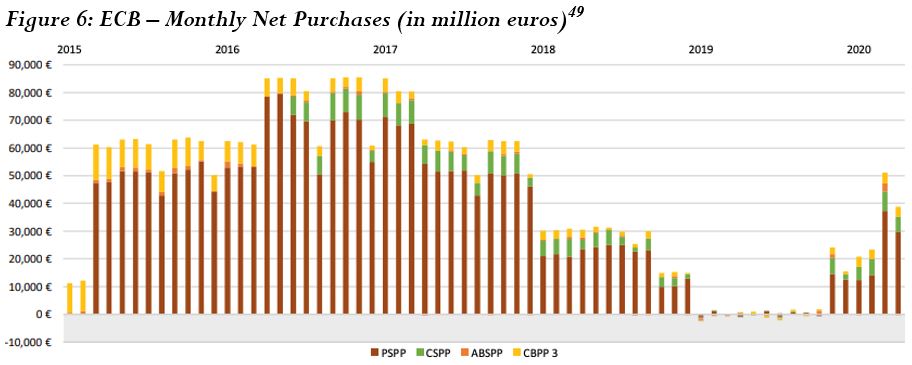
The ECB bought assets via the Eurozone's NCBs to the tune of 60 to 80 billion between 2015 and 2017, the bulk of which were public sector debt securities (Figure 6). Because of the prohibition of direct monetary financing of sovereigns, these purchases happen on secondary markets from private actors and never from the issuing authority itself. While the volume of assets purchased by each NCB is determined by the Eurosystem capital key, in the short term the composition of the purchased asset portfolio may deviate from the capital key. In this context, T2 balances remain flat if all NCBs purchased assets exclusively from domestic counterparties or if the value of assets purchased abroad exactly equaled the value of assets purchased by foreign NCBs. However, banking relations in the Eurozone remain asymmetric. 25 percent of market participants hold 98 percent of liquidity.48 Additionally, particularly large (foreign) investors tend to cluster in a small number of multinationals in the most liquid markets. Therefore, asset purchases are geographically concentrated and tend to inject liquidity into central bank areas that host large financial institutions with foreign capital. For instance, if the Banca d'Italia purchases more assets (on behalf of the ECB) from non-resident counterparties in Germany than vice versa, the Bundesbank credits the T2 accounts of asset sellers with the value of the payment and reports a net T2 claim. As a result of its geographic concentration, the implementation process of asset purchases thus provokes a divergence of T2 positions. Only in a monetary union with balanced banking institutions and channels where investors' liquidity preferences do not depend on geography would asset purchases by the central bank be inconsequential for a cross-border payment system.
While the presence of a mechanical effect is largely undisputed, its importance and impact on T2 positions is not. Authors including Dor,50 Minenna,51 and Febrero et al.52 , using national BoP data, argue that the direct effect of asset purchases alone cannot account for the renewed T2 divergence since 2015. Their main argument revolves around rising T2 liabilities of Spain and Italy and the fact that roughly 50 and 65 percent of Spanish and Italian sovereign debt, respectively, is held domestically. Thus, for T2 balances to be the effect of asset purchases, the Spanish and Italian NCBs would have had to buy from an unrepresentative sample of investors. Yet, ECB asset purchases not only have a direct mechanical effect but also a time-lagged indirect effect on the T2 positions of the involved NCBs. The indirect effect comes in form of a second-round capital flight, whereby liquidity injected by asset purchases in the periphery flows toward financial institutions in the core. This reinforces the direct effect and amplifies T2 claims and liabilities in the process.53
The divergence of T2 positions after 2015 is not a distinct phenomenon. While more recent T2 imbalances largely originated from ECB asset purchases, they remain a symptom of persistent financial fragmentation and banking asymmetries in the Eurozone.54 The persistence of T2 claims and liabilities shows that large investors prefer to hold liquidity in a limited number of financial institutions and central bank areas. It also suggests that institutional investors and commercial banks associate higher liquidity, credit, and redenomination risk with holding liquidity in countries with T2 liabilities. Importantly, if investors (partly) base their decisions on where to hold liquidity on T2 positions, T2 liabilities, like credit and redenomination risk, are not only self-fulfilling but self-reinforcing.
Conclusion
The debate around T2 net balances made an unlikely entrance into the political limelight during the financial crisis in the Eurozone. Authors enmeshed a valid endeavor to better understand the nature of rising T2 balances with biased arguments about excessive trade deficits and profligacy in the Eurozone's periphery. They argued that fueled by foreign capital inflows after the formation of EMU, wages, prices, and trade deficits rose in peripheral countries and compromised competitiveness vis-à-vis the rest of the Eurozone. In their view, public monetary institutions stepped up and financed excessive trade deficits via T2 after private capital withdrew in 2007. However, empirical evidence for this argument is patchy. Data on real unit of labor costs and real effective exchange rates do not show a systematic loss of competitiveness in peripheral countries. Moreover, there is little evidence for a systematic correlation between changes in the current account and changes in T2 positions. In fact, theoretical inspection of the Balance of Payment shows that current account data is ‘silent' on the direction of financial flows and the resulting distribution of risk.
The real drivers behind T2 balances were of a financial nature. During the crisis, (perceived) risk differentials between Eurozone countries fragmented money markets and gave rise to large differences in liquidity preference. Investors and commercial banks subsequently disengaged from markets in distressed parts of the Eurozone. The resulting cross-border flows were often routed via large intermediaries concentrated in the most liquid markets. National central banks in countries like Germany, Finland, or the Netherlands thus reported large T2 claims while the liquidity-exporting central bank areas in Ireland, Spain, Portugal, Italy, and Greece reported corresponding liabilities. After a period of ‘normalcy' between 2012 and 2014, T2 balances diverged again due to the Asset Purchase Programmes of the ECB. Implemented by national central banks, asset purchases have direct and indirect effects that create excess liquidity in Germany and Netherlands where large-scale investors and bondholders are clustered.
T2 is a constitutive feature of the Eurosystem because it acts as guarantor that euros are settled at par value irrespective of their origin in the monetary union. Understanding the fundamental role that the payment system plays for the integrity of the Eurozone can help inform the policy debate around mounting T2 balances. If implemented, current proposals to impose limits on T2 liabilities or collateralize them with eligible assets would only aggravate the financial fragmentation they supposedly attempt to fix. Crucially, in a future crisis, constraints on T2 would incentivize investors to bet against an NCB's capacity to comply with the conditions imposed on T2 liabilities. Thus, modifications to T2 threaten to turn the Eurozone into a monetary union with asterisk because money could cease to be fully fungible across all central bank areas.
Footnotes
1 ECB (2011). Monthly Bulletin October 2011. Issue 10/2011. Frankfurt am Main: European Central Bank, p.35.
2 Sinn, H. W. (2011). The ECB's stealth bailout. VoxEU.org, 1.
3 Cecioni, M., & Ferrero, G. (2012). Determinants of TARGET2 imbalances. Bank of Italy Occasional Paper, (136).
4 Schelkle, W. (2017). The political economy of monetary solidarity: understanding the euro experiment. Oxford University Press, p.275
5 Alloway, T. (2011). The wonkiest web debate ever – Germany's ‘stealth bailout'. The Financial Times. Retrieved from here
6 Stephens, P. (2019). Germany hides the awkward truth about the euro. The Financial Times. Retrieved from here.
7 Blake, D. P. (2018). Target2: The silent bailout system that keeps the Euro afloat. Available at SSRN 3182995.
8 Mayer (2018). Ein Wahnsinn namens Target 2. Frankfurter Allgemeine Zeitung (14 July 2018). Retrieved here; Sinn, H. W. (2018a). Fast 1 000 Milliarden Target-Forderungen der Bundesbank: Was steckt dahinter?. ifo Schnelldienst, 71(14), p.26-37; Sinn, H. W. (2018b). Irreführende Verharmlosung. Frankfurter Allgemeine Zeitung (05 August 2018). Retrieved here
9 Bundestag (2019). Fraktionen kritisieren AfD-Antrag zu Target-Forderungen. Drucksache 19/9232. Retrieved here.
10 Sinn (2011); Sinn, H. W. (2012). Fed versus ECB: How TARGET debts can be repaid. VoxEU.org, 10; Sinn, H. W. (2014a). The Euro trap: On bursting bubbles, budgets, and beliefs. OUP Oxford.
11 Schelkle (2017)
12 Deutsche Bundesbank (n.d.). From TARGET to TARGET2. Frankfurt am Main: Deutsche Bundesbank. Retrieved here
13 BIS (2003a). The role of central bank money in payment systems. Committee on Payment and Settlement Systems. Basle: Bank of International Settlements, p.2
14 ECB (2020). TARGET Annual Report 2020. Frankfurt am Main: European Central Bank.
15 Ibid.
16 BIS (2003b). Glossary. Basle: Bank of International Settlements. Retrieved here, p.517.
17 Society for Worldwide Interbank Financial Telecommunication
18 Jobst, C., Handig, M., & Holzfeind, R. (2012). Understanding Target2: the eurosystem's euro Payment System from an economic and Balance Sheet Perspective. Monetary Policy & the Economy Q, 1, p.81-91.
19 Bindseil, U., & König, P. J. (2011). The economics of TARGET2 balances. Humboldt-Universität zu Berlin, Wirtschaftswissenschaftliche Fakultät.
20 Garber (2010) cited in Bindseil & König (2011)
21 Mazzocchi, R., & Tamborini, R. (2019). Current account imbalances and the Euro Area. Alternative views. Alternative Views (January 2019), p.15.
22 Wolman, A. L. (2013). Federal Reserve interdistrict settlement. FRB Economic Quarterly, 99(2), 117-141
23 Sinn (2014).
24 Tornell, A., & Westermann, F. (2012). Greece: The sudden stop that wasn't. In CESifo Forum (Vol. 13, No. Special Issue, pp. 102-103). München: ifo Institut-Leibniz-Institut für Wirtschaftsforschung an der Universität München.
25 Euro Crisis Monitor, Osnabrück University
26 Sinn (2014).
27 Auer, R.A. (2014). What drives TARGET2 balances? Evidence from a panel analysis. Economic Policy, 29(77), 139-197; Schelkle (2017), p.286-291.
28 AMECO Database, European Commission
29 Sinn (2014), p.41-47.
30 Fahrholz, C., & Freytag, A. (2012). Will TARGET2-Balances be Reduced again after an End of the Crisis? (No. 30). Working Papers on Global Financial Markets.
31 Sinn (2014), p.117.
32 Felipe, J., & Kumar, U. (2014). Unit labor costs in the Eurozone: the competitiveness debate again. Review of Keynesian Economics, 2(4), 490-507.
33 AMECO Database, European Commission
34 Ibid.
35 Jones, E. (2009). The Euro and the financial crisis. Survival, 51(2), 41-54.
36 AMECO Database, European Commission
37 Gabrisch, H. (2017). Explaining trade imbalances in the euro area: Liquidity preference and the role of finance. PSL Quarterly Review, 70(281).
38 Borio, C. E., & Disyatat, P. (2015). Capital flows and the current account: Taking financing (more) seriously. BIS Working Papers. Basle: Bank for International Settlements.
39 Hale, G., & Obstfeld, M. (2014). The Euro and The Geography of International Debt Flows. https://doi.org/10.3386/w20033
40 Sinn (2014).
41 Auer (2014).
42 Ibid; Cecchetti, S. G., McCauley, R. N., & McGuire, P. (2012). Interpreting TARGET2 balances. BIS Working Papers. Basle: Bank for International Settlements.
43 Buiter, W. H., Rahbari, E., & Michels, J. (2011). The implications of intra-euro area imbalances in credit flows. CEPR policy insight, 57, 1-14.
44 Hale & Obstfeld (2014).
45 IHS Markit
46 Minenna, M. (2017). Guest post: The ECB's story on Target2 doesn't add up. FT Alphaville (14 September 2017). The Financial Times. Retrieved here
47 Ibid.
48 ECB (2020).
49 European Central Bank
50 Dor, E. (2016). Explaining the surge of TARGET2 liabilities in Italy: less simple than the ECB's narrative. Available at SSRN 2860545.
51 Minenna (2017).
52 Febrero, E., Uxó, J., & Álvarez, I. (2019). Target2 imbalances and the ECB's asset purchase programme. An alternative account. Panoeconomicus, 1-21.
53 Minenna (2017).
54 Deutsche Bundesbank (2016); DNB (2016). Target2 imbalances reflect QE and persistent fragmentation within the euro area. DNBulletin (16 June 2016). De Nederlandsche Bank. Retrieved here

